Debugging Basics
Accessing the Dev Menu
React Native provides an in-app developer menu which offers several debugging options. You can access the Dev Menu by shaking your device or via keyboard shortcuts:
- iOS Simulator: Cmd ⌘ + D (or Device > Shake)
- Android emulators: Cmd ⌘ + M (macOS) or Ctrl + M (Windows and Linux)
Alternatively for Android devices and emulators, you can run adb shell input keyevent 82 in your terminal.
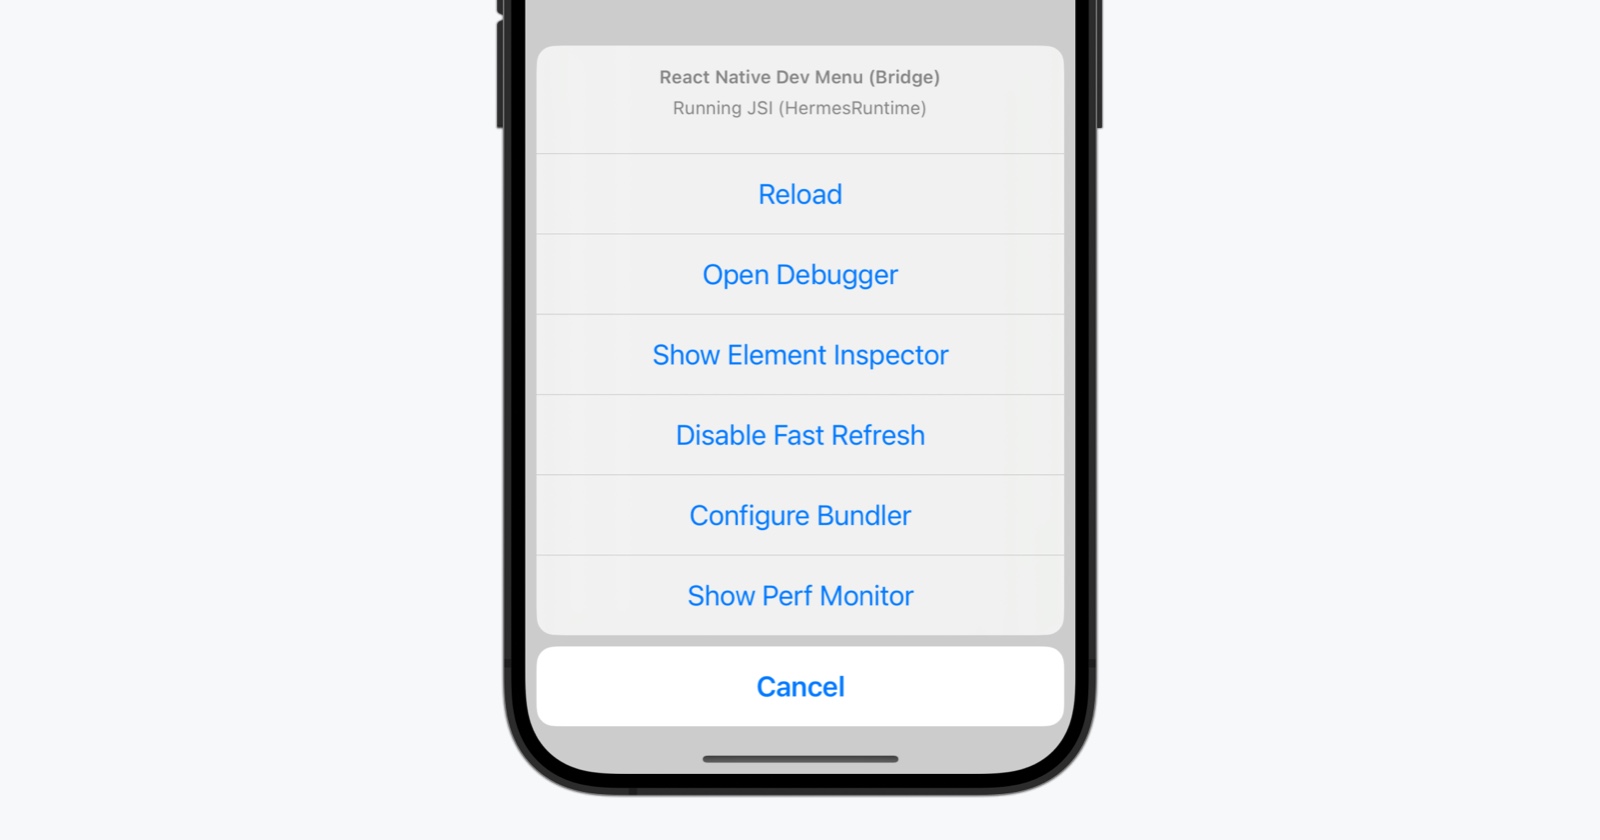
The Dev Menu is disabled in release (production) builds.
Opening the Debugger
The debugger allows you to understand and debug how your JavaScript code is running, similar to a web browser.
In Expo projects, press j in the CLI to directly open the Hermes Debugger.
- Hermes Debugger / Expo
- Flipper
- New Debugger (Experimental)
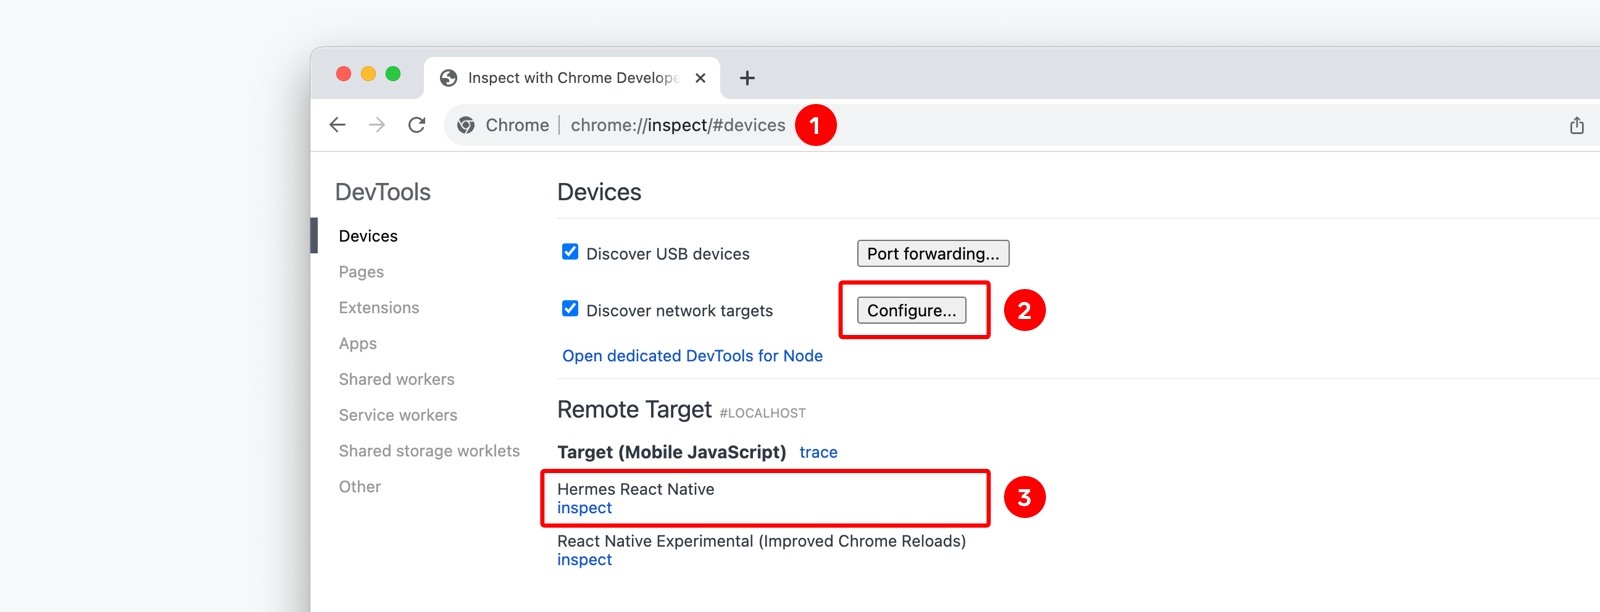
Hermes supports the Chrome debugger by implementing the Chrome DevTools Protocol. This means Chrome's tools can be used to directly debug JavaScript running on Hermes, on an emulator or on a physical device.
- In a Chrome browser window, navigate to
chrome://inspect. - Use the "Configure..." button to add the dev server address (typically
localhost:8081). - You should now see a "Hermes React Native" target with an "inspect" link. Click this to open the debugger.
Flipper is a native debugging tool which provides JavaScript debugging capabilities for React Native via an embedded Chrome DevTools panel.
To debug JavaScript code in Flipper, select "Open Debugger" from the Dev Menu. Learn more about Flipper here.
To debug using Flipper, the Flipper app must be installed on your system.
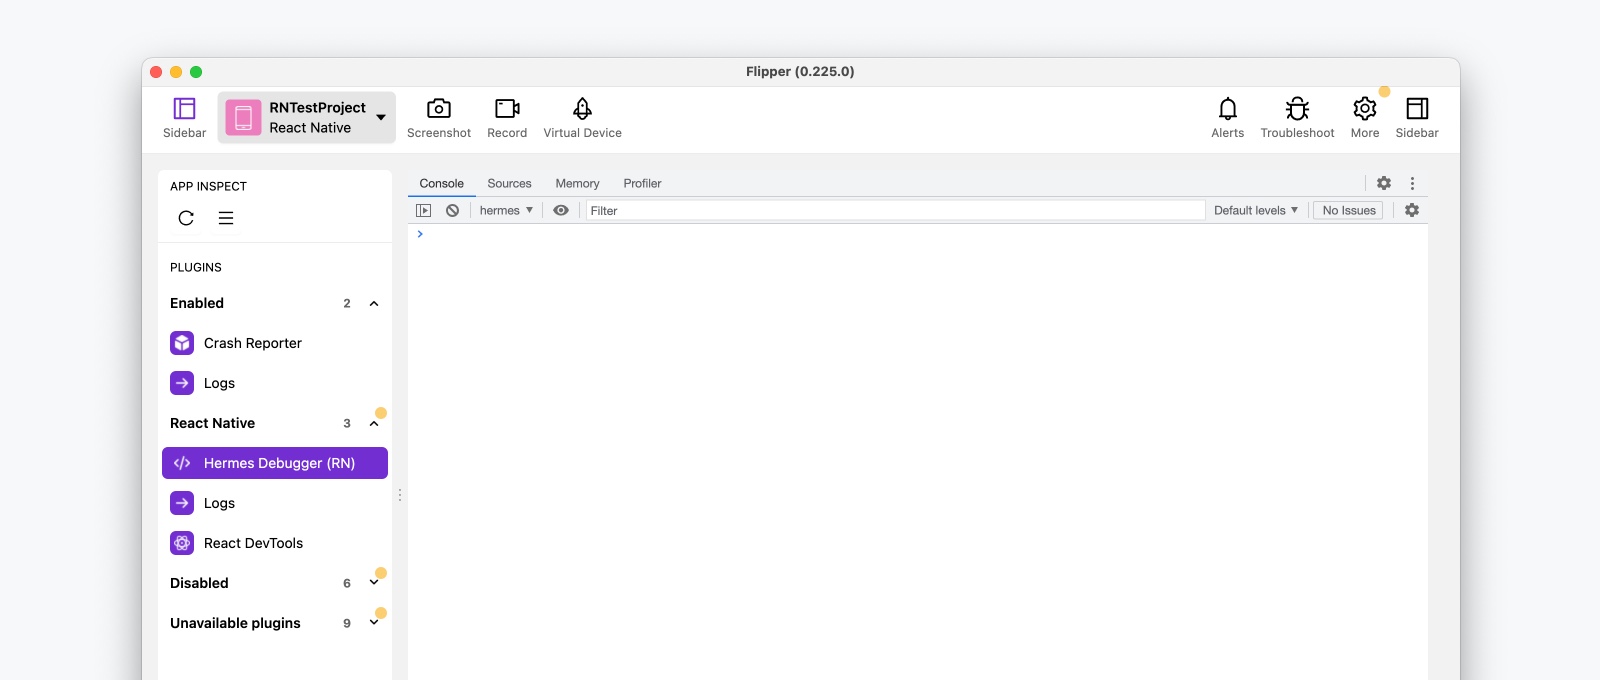
Debugging React Native apps with Flipper is deprecated in React Native 0.73. We will eventually remove out-of-the box support for JS debugging via Flipper.
Alternative debugging tools
As React Native transitions away from Flipper, we recommend other existing methods, including first party IDEs, to inspect your application's native code and behaviour.
This is an experimental feature and several features may not work reliably today. When this feature does launch in future, we intend for it to work more completely than the current debugging methods.
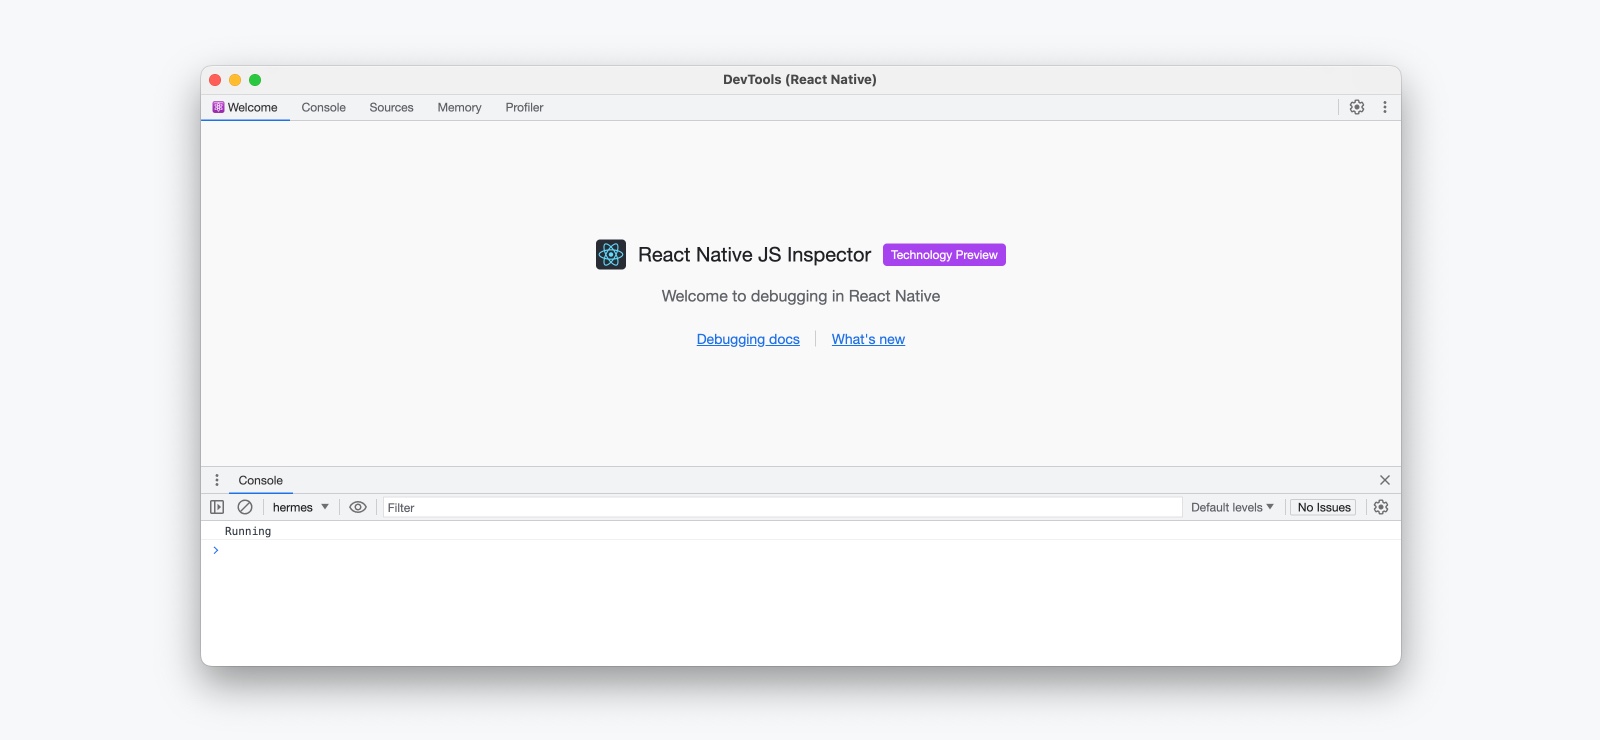
The React Native team is working on a new JavaScript debugger experience, intended to replace Flipper, with a preview available as of React Native 0.73.
The new debugger can be enabled via React Native CLI. This will also enable j to debug.
npx react-native start --experimental-debugger
When selecting "Open Debugger" in the Dev Menu, this will launch the new debugger using Google Chrome or Microsoft Edge.
React DevTools
You can use React DevTools to inspect the React element tree, props, and state.
npx react-devtools
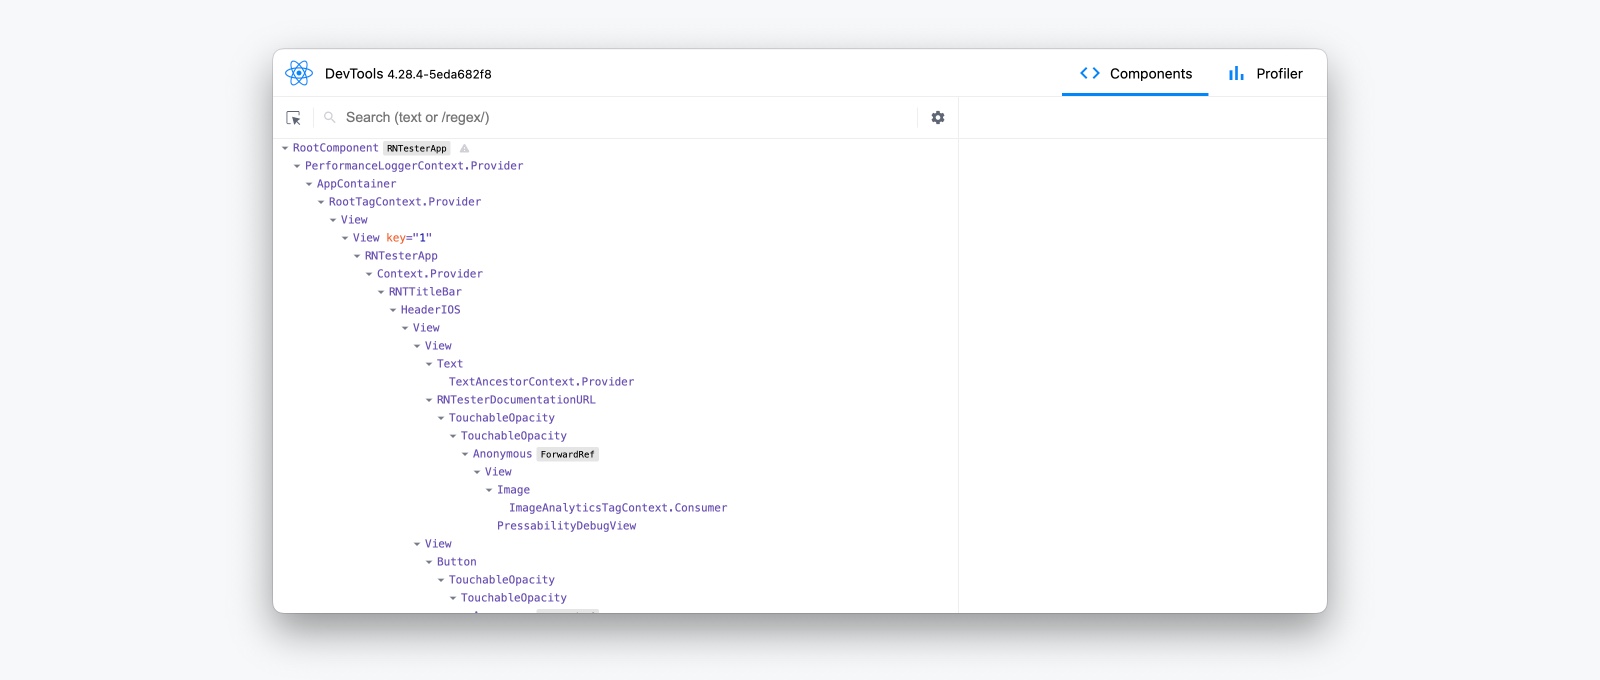
Learn how to use React DevTools!
LogBox
LogBox is an in-app tool that displays when warnings or errors are logged by your app.
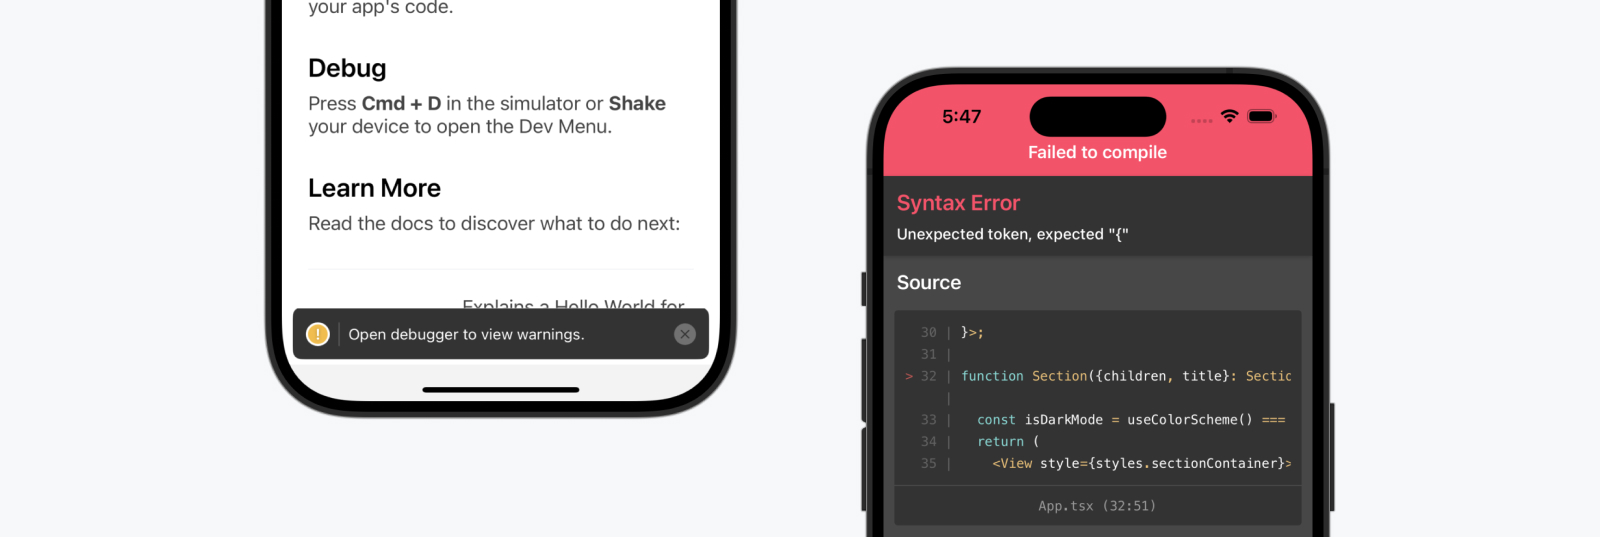
LogBox is disabled in release (production) builds.
Fatal Errors
When an unrecoverable error occurs, such as a JavaScript syntax error, LogBox will open with the location of the error. In this state, LogBox is not dismissable since your code cannot be executed. LogBox will automatically dismiss once the syntax error is fixed — either via Fast Refresh or after a manual reload.
Console Errors and Warnings
Console errors and warnings are displayed as on-screen notifications with a red or yellow badge.
- Errors will display with a notification count. Tap the notification to see an expanded view and to paginate through other logs.
- Warnings will display a notification banner without details, prompting you to open React Native DevTools.
When React Native DevTools is open, all errors except fatal errors will be hidden to LogBox. We recommend using the Console panel within React Native DevTools as a source of truth, due to various LogBox options which can hide or adjust the level of certain logs.
💡 Ignoring logs
LogBox can be configured via the LogBox API.
import {LogBox} from 'react-native';
Ignore all logs
LogBox notifications can be disabled using LogBox.ignoreAllLogs(). This can be useful in situations such as giving product demos.
LogBox.ignoreAllLogs();
Ignore specific logs
Notifications can be disabled on a per-log basis via LogBox.ignoreLogs(). This can be useful for noisy warnings or those that cannot be fixed, e.g. in a third-party dependency.
LogBox.ignoreLogs([
  // Exact message
  'Warning: componentWillReceiveProps has been renamed',

  // Substring or regex match
  /GraphQL error: .*/,
]);
LogBox will treat certain errors from React as warnings, which will mean they don't display as an in-app error notification. Advanced users can change this behaviour by customising LogBox's warning filter using LogBoxData.setWarningFilter().
Performance Monitor
On Android and iOS, an in-app performance overlay can be toggled during development by selecting "Perf Monitor" in the Dev Menu. Learn more about this feature here.

The Performance Monitor runs in-app and is a guide. We recommend investigating the native tooling under Android Studio and Xcode for accurate performance measurements.